Brief
Redesigning Bloom Personalized Equity Access Plan
My Contribution
Problem area analysis, User journey mapping, Wireframes, User experience and interface design.
What is Equity Access Plan?
Equity Access Plan is a financial report designed to provide homeowners with a clear overview of the value available in their current property. The report offers actionable insights on how to access this value, along with projections for potential future growth.
The plan is specifically tailored for homeowners aged 55 and above and forms an integral part of Bloom’s Reverse Mortgage product. By presenting complex financial information in a structured and accessible way, the Equity Access Plan helps customers make informed decisions about leveraging their home equity to support their long-term financial goals.
Problem Area

Business Goals
For Equity Access Plan
- Build Trust by presenting financial data in a clear and transparent way.
- Improve Understanding for 55+ homeowners with simple, actionable insights.
- Boost Engagement through personalized and interactive reports.
- Support Decisions by showing growth projections and financial outcomes.
- Increase Conversions by positioning Bloom as a transparent, customer-first FinTech.
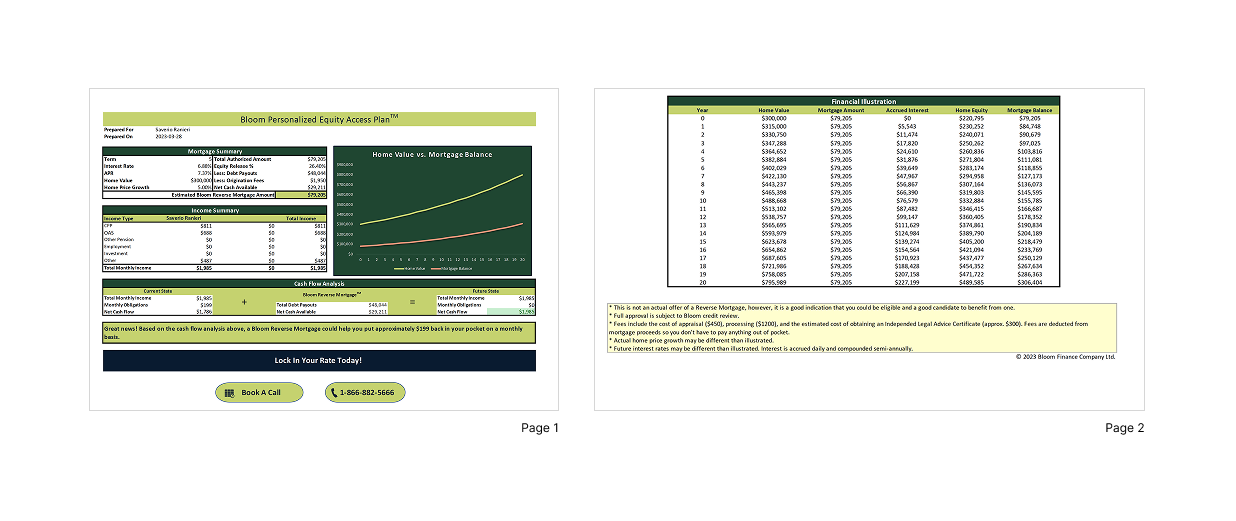
Current Report
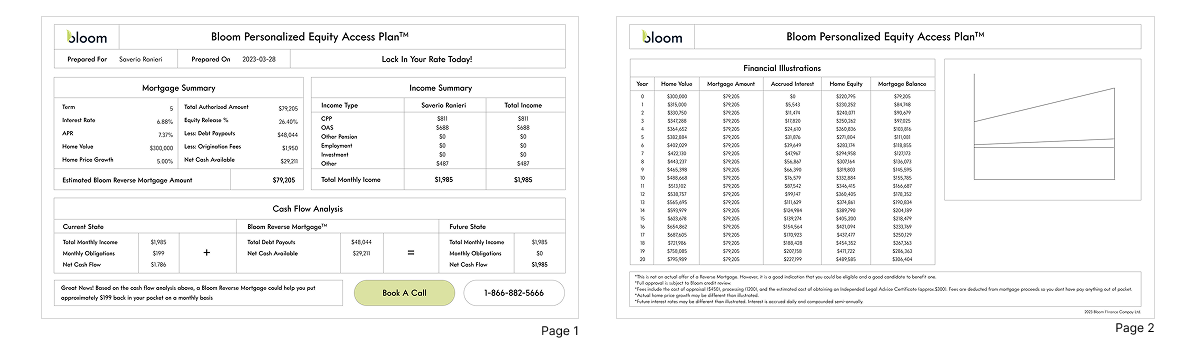
Wireframing
Design Goals
- Prioritize Clarity
- Intuitive
- Create Visual Flow
Research
Competitive Benchmarking
Reviewed financial reports from top banks and mortgage providers to analyze layout structures, use of data visualization, hierarchy of content, and tone of communication. This revealed that while most reports are data-rich, they often overwhelm users with dense tables and jargon-heavy language.
User Perspective Study
Explored how homeowners particularly those aged 55+ interpret financial reports. Insights showed a preference for plain language summaries, visual cues such as charts or graphs, and step-by-step guidance over long narrative text.
Accessibility & Legibility Review
Researched readability standards (e.g., font size, contrast, plain language guidelines) to ensure the redesigned report would be clear for older readers.
Information Architecture Analysis
Examined how data is layered in reports versus how users want to consume it. Findings emphasized the need for a top-down structure: starting with high-level takeaways, followed by detailed breakdowns, and ending with supporting technical notes.
Design Inspiration
Looked beyond the finance sector at annual reports, healthcare summaries, and government-issued benefit statements, which successfully balance complexity with clarity. These sources provided cues on visual hierarchy, iconography, and progressive disclosure techniques.
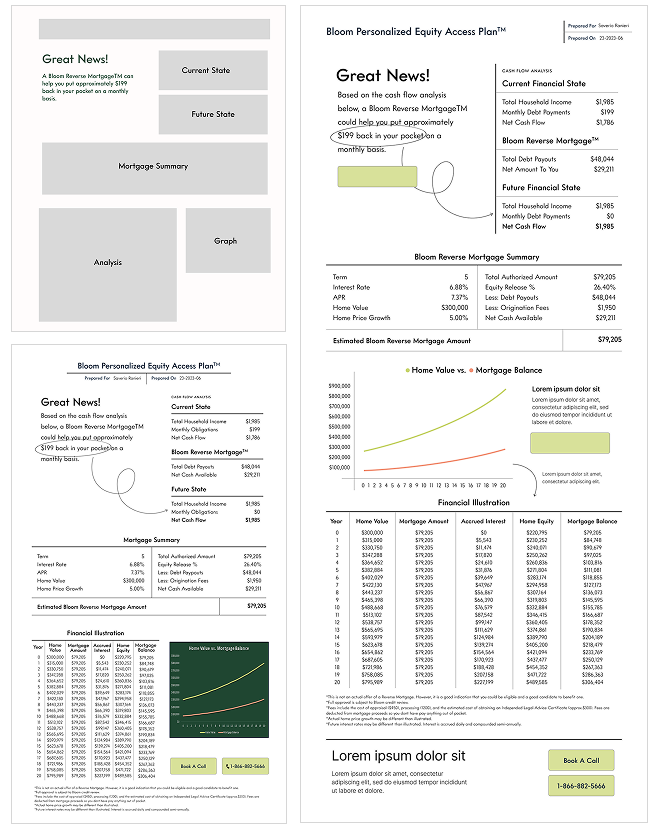
New Layout
Goals
- Establish Visual Flow – Guide readers’ eyes through content in a logical, purposeful sequence.
- Highlight Key Insights – Surface the most critical financial metrics and trends without overwhelming detail.
- Support Layered Exploration – Allow readers to quickly grasp high-level takeaways while offering deeper detail for those who need it.
Iterations
- Number of rounds of iteration went through keeping visual flow, highlighing key insights.
- Only keeping the information which is most useful for user, removing all the excess information.
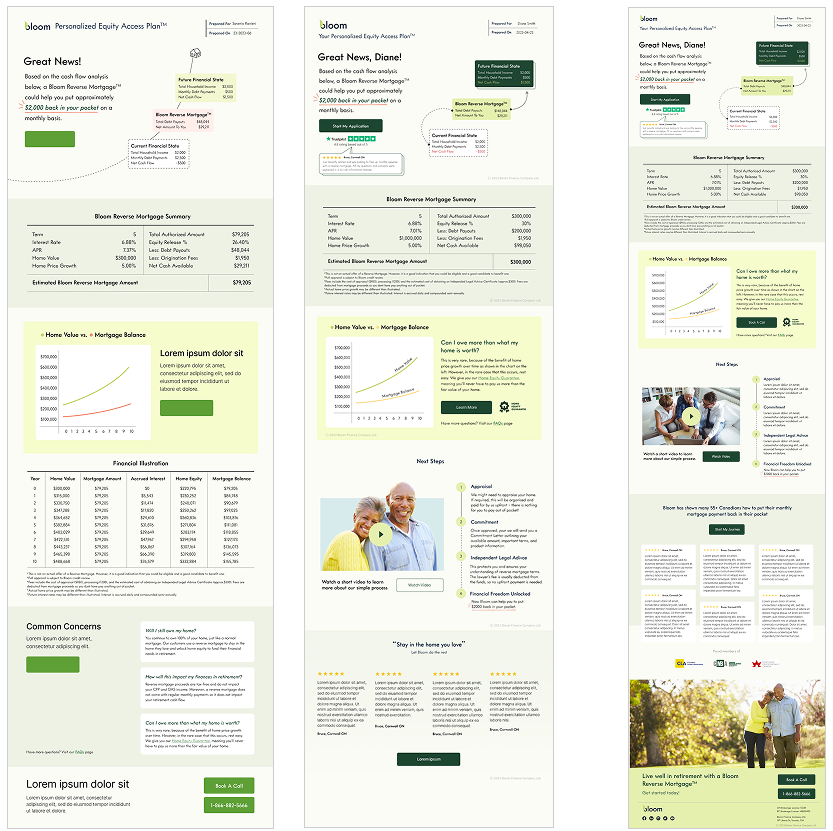
Final Layout

Impact
The redesigned report not only communicated financial performance more effectively but also built trust and engagement with its audience. Readers could now:
- Grasp essential insights at a glance
- Navigate deeper details without losing context
- Experience a consistent and professional design that reflected the credibility of Bloom